In this post I will show how to visually inspect the contents of Webpack bundles.
In a large web application it's easy to lose track of your JavaScript dependencies as the application grows. Before you know it you will have a large dependency graph of external and internal code.
Wouldn't it be nice if you could create a visual graph of your dependencies with relative sizes?
It turns out the Webpack BundleAnalyzerPlugin will do just that.
All you have to do is add the plugin to your webpack config like so:
The plugin works based on sourcemaps, so you have to remember to enable the devtool (source-map) setting to generate a source map.
The BundleAnalyzerPlugin is available from npm. Just run:
To create a suitable example I ran the plugin against the app I generated in a previous article.
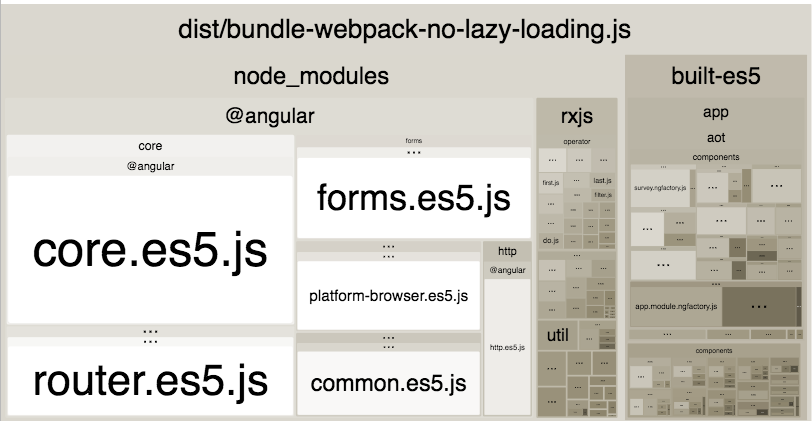
The bundle graph ended up looking like this:

Each block in the graph represents a separate piece of the bundle. Hovering over individual blocks will give you both the gzipped size as well as the parsed size.